

Aug 7, 2025
Dr. Charles Plante is the Houston Family Postdoctoral Research Fellow in Health and Social Inequality at the Johnson Shoyama Graduate School of Public Policy at the University of Saskatchewan and the former Policy Director of Upstream Institute for a Healthy Society. He is the lead author of “Poverty Costs Saskatchewan: A New Approach to Prosperity for All” and coauthor of “Combating Poverty: Quebec’s Pursuit of a Distinctive Welfare.”
What are the costs of poverty in Saskatchewan? What are the benefits of addressing these costs? What policies and practices can we put into place to address these issues?
Why consider the costs of poverty?
When we think about interventions that we enact to alleviate poverty, it is all too often common practice to frame them as “all cost and no benefit.” When we started talking about the cost of poverty a few years ago, one of the main things that we wanted to bring to the floor was that poverty is extremely expensive not only the poor, but also our community as a whole. Dealing with poverty, then, could actually generate a return and create a lot of benefits.
Calculating the costs of poverty: the journey begins
In 2014, we assembled a team to calculate and promote awareness about the costs of poverty in Saskatchewan. We called this campaign “Poverty Costs”. I led the calculation side of things to determine the cost of poverty for 2010.
“Poverty Costs” came out of work that had been done previously in the community, including work by the Saskatoon Poverty Reduction Partnership (SPRP) and other local partners to raise awareness about poverty. Many people expressed interest in this work and participated in challenges where they had to live for a month on food bank rations or try to survive on social assistance levels. After these challenges, people were asking “what’s next?” Meanwhile, policymakers were saying “well, we can’t necessarily afford to do anything about it.”

At the time, Saskatchewan didn’t have a poverty reduction strategy, so that was really the main ask of the campaign. We used poverty costs and the numbers that we generated as an opportunity to get people talking about poverty, but also to get them thinking about what could be done next.
Calculating the Costs of Poverty
In order to calculate the costs of poverty, we used a method informally referred to as the Laurie Method, named after Nathan Laurie, who worked with the Ontario Association of Food Banks (now Feed Ontario) around 2007 and developed this method for calculating the cost of poverty in Ontario and Canada as a whole. Since that time, the costs of poverty have been estimated for almost every province, with Saskatchewan being the eighth province to calculate the costs.

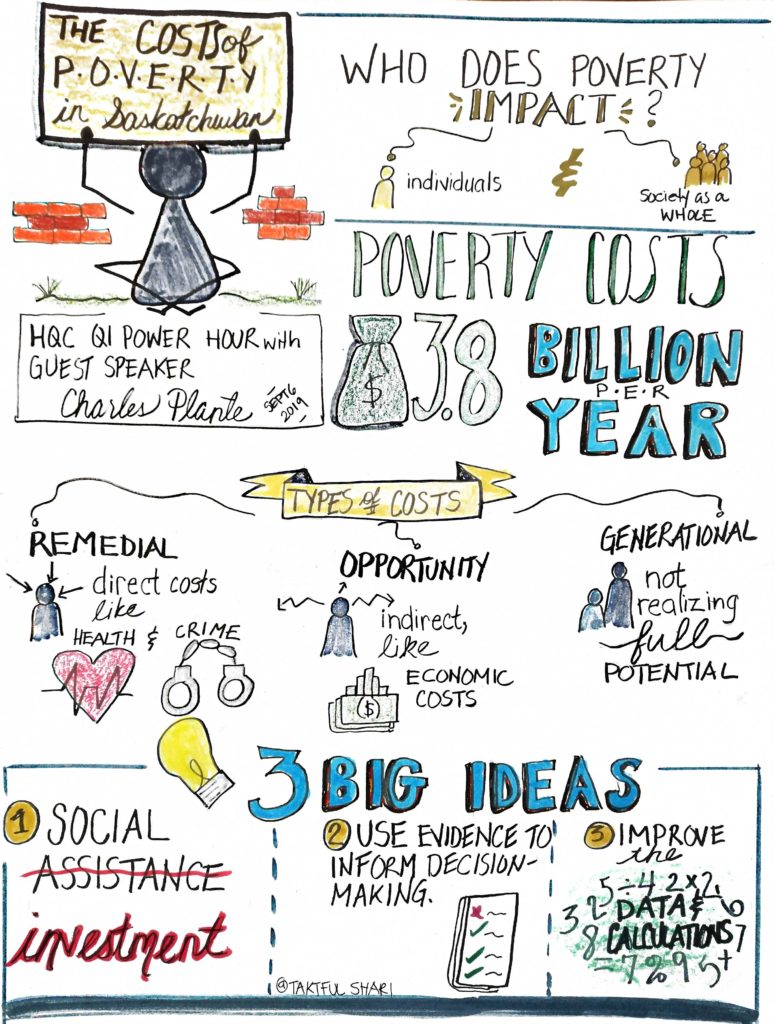
The Laurie Method asks what the savings and gains would be to individuals and society if we raised the standard of living of the poor to the level achieved by the second income quintile (people in the middle of society). When we calculate the Laurie Method, we look at a bunch of different outcomes and we end up comparing the outcomes of low-income groups with middle-income groups. We assign a monetary value to the differences and then add them to get our total costs. The Laurie Method considers three different categories of costs: remedial costs, opportunity costs, and intergenerational costs.
- Remedial costs are the direct costs associated with treating the damage caused by poverty: poverty causes poor people degradation and society must make investments to treat that degradation.
- Opportunity costs refer to a more indirect category of costs associated with the opportunities that people miss when they’re poor. It costs money to participate in society, and when people don’t have the resources that they need, they end up missing social and economic opportunities and that impact can extend to the whole economy.
- Intergenerational costs refer to the lasting impact—both in terms of direct and indirect costs—that people experiencing poverty are less likely to be able to realize their full potential in life—not just in the current year, but for many years to come. This applies particularly to children that have grown up in poverty.
1. Remedial Costs
Remedial costs consider two primary categories of costs: health costs and crime costs. Poverty places a disproportionate burden on the health of the poor and, ultimately, the health system.
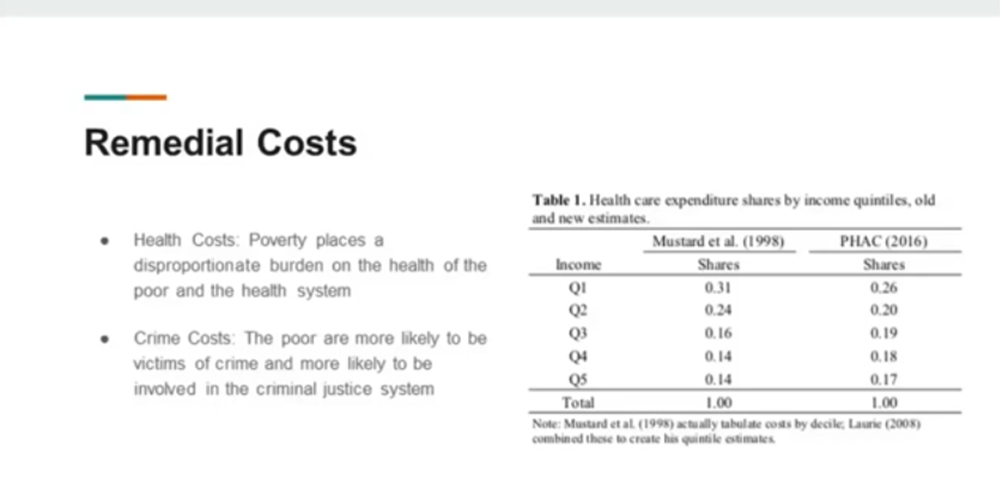
In the past and in the initial Laurie Method the estimates were calculated based on a Manitoba study called The Mustard Study. This study found there was disproportionate health system usage by income quintile in Manitoba. More recently we’ve been able to benefit from research that’s been done by the Public Health Agency of Canada that’s looked at this distribution for the entire country. As we get better data, we’re able to improve our calculations.
In addition to the damage that poverty causes people’s bodies, it can also damage their social relationships within communities and the cohesiveness of communities. This can often lead to increased crime costs, both in terms of individuals being more likely to become caught up in the criminal justice system, and the poor being more likely to become victims of crime. That’s important to always keep in mind.
2. Opportunity Costs
Opportunity costs are those missed opportunities and the fact that people experiencing poverty can’t participate in society.
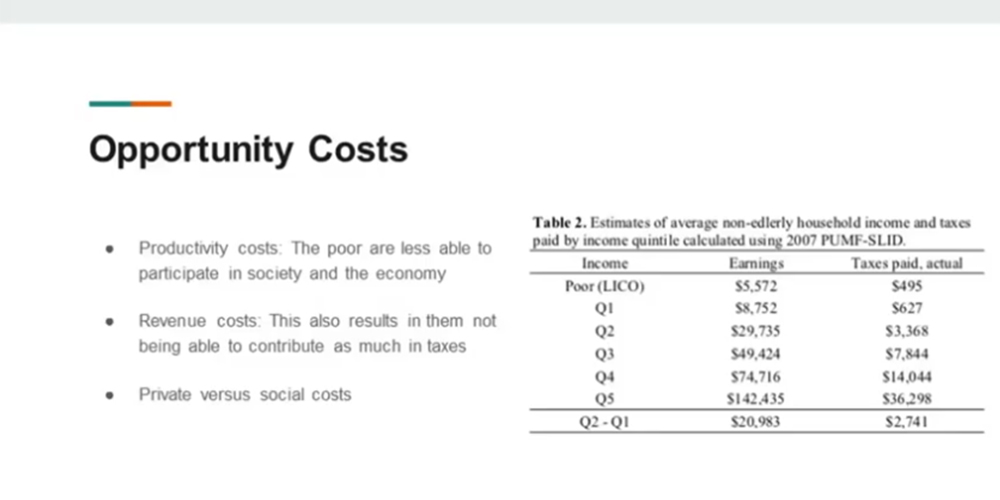
We often think of this in terms of the economic: as a society, especially in a modern and advanced industrialized and post-industrialized economy, a lot of our wealth comes from our human capital, the wellbeing of our people, and the intelligence and abilities of our populations. Poverty not only causes the degradation of that but also prevents people from being able to fully integrate.
A tangible example of opportunity costs might be an individual whose income is so low that they’re unable to afford a bus pass to be able to get to work, and that ends up passing on costs to employers and to the economy. Another example might be a mother who is unable to afford the cost of childcare so she can continue to participate in the labour market and contribute to the economy as she might like to, but can’t afford to because of her poverty.

In addition to there being direct earnings costs, there are also revenue costs. In the Laurie Method, they emphasize that lower productivity and accessibility to the workforce results in less revenue for the state. They also differentiate between private and social costs, with the foregone earnings and productivity being private costs and the foreground state revenues being social costs.
I don’t personally love that distinction that Laurie draws between private and social opportunity costs because I think in our society, we talk a lot about GDP as an important indicator and use it all the time to evaluate ourselves and how we’re doing. Productivity and earnings are integral factors that determine GDP, so there’s a direct relationship between poverty, earnings, and subsequently GDP.
3. Intergenerational Costs
Intergenerational costs relate to the fact that children who grew up in poverty are a lot more likely to end up living in poverty as adults. They’re also a lot less likely to end up in higher income brackets and achieve higher levels of achievement.
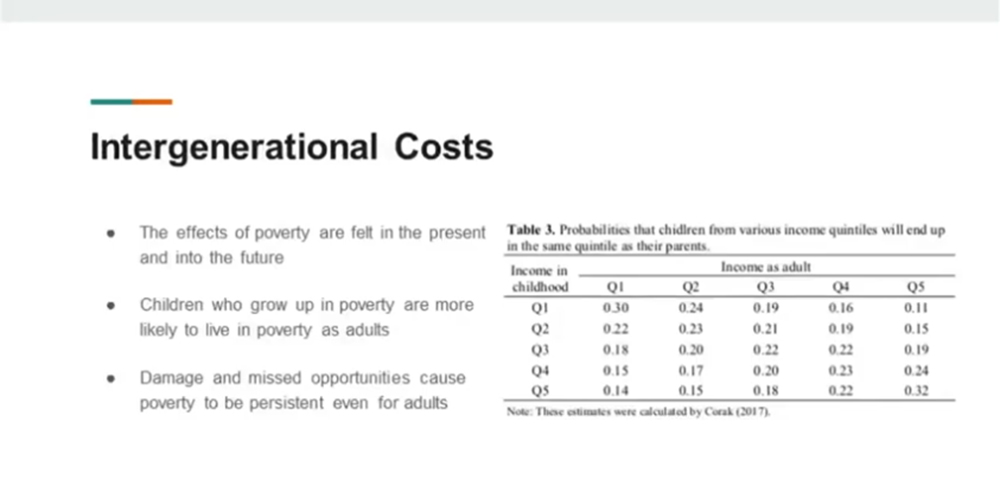
In order to calculate intergenerational costs, we worked with research by the economist Miles Corak who examined this throughout the country and did some impressive research on intergenerational mobility in Canada. We studied how much more the lowest income quintile could have achieved in life if they had been able to reach heights similar to individuals from higher-income quintiles. The results ended up reflecting both the damage and missed opportunities mentioned earlier.
When we calculated in 2014 for 2010, we estimated that the costs of poverty in Saskatchewan at that time were about $3.8 billion each year:
- $420 million in heightened healthcare costs,
- $50 to $120 million in additional increased spending in the criminal justice system,
- $2.6 billion in lost contributions to GDP and taxes, and
- $720 million in increased social assistance spending.
More recently, I’ve been able to update the costs and recalculate them using a method that I’ve been working on with Iglika Ivanova, an economist in Vancouver who spearheaded the poverty cost calculations for BC several years ago. We’ve been working on improving the method and recalculating the cost of poverty all the way up to 2016. We’re working with the same three categories of costs and a lot of the same information with one difference being how we’ve been treating social assistance costs.
Our latest estimates show that the costs of poverty are very similar today to what they were previously in Saskatchewan, with a cost of around 4.5 to 5% of GDP, or $3.8 billion a year. In per capita terms, this cost is upwards of $3,000 per citizen annually, including children.
Overall, regardless of how you calculate them, the costs of poverty are large and prohibitive, which places a lot of pressure on the Saskatchewan economy. More specifically, the health costs of poverty equate to around half a billion dollars, which when compared to the approximately $5.83 billion overall budget of the Ministry of Health, is a lot.
Social Assistance as a Social Investment
So, what do the costs of poverty suggests for policy and practice? My favourite types of policies and solutions are those that follow the idea that the right thing to do is also the smart thing to do. When calculating the costs of poverty, I find that we’re able to see more clearly that when these two objectives align, real opportunities start to emerge.

One thing that we can think about differently when we examine the cost of poverty is social assistance. When we think of social assistance as charity, there’s more of an inclination not to prioritize it. However, when we emphasize the costs and benefits, we start to think of social assistance as an investment instead.
In the case of our numbers, the cost of poverty suggests an upper limit on how much we can afford to spend to reduce poverty. At this point we’re nowhere near that threshold in Canada: we invest around 5 to 7% of the total cost of poverty on social assistance, so we have a long ways to go before we have to start worrying about spending more to remedy poverty than poverty is costing us. As we make these costs explicit, we can start examining which policies and interventions are most efficient at reducing the costs of poverty.

Calculating the costs of poverty is important because it reorients how we think about spending on poverty. Many approaches to poverty alleviation focus on providing people with income, but when we examine the costs of poverty, we’re not only looking at people’s incomes but also looking at their outcomes in terms of health, justice, and economics. The policies that are going to be most effective at reducing the costs of poverty are those that narrow the gap and outcome between low-income or poor people and those in the middle of society. Therefore, investments in programs and services could be more effective than simply directing transfers.
Improving Poverty Cost Calculations
There’s a lot we can do to improve our costs of poverty estimates. When we did our numbers in 2014, we had to calculate them for 2010, because that was the data we had access to at the time. Today, the turnaround is a little bit faster, and I’m able to calculate up to 2016 in mid-2019 and I should be able to do up to 2017 in the next month or two. However, I’m still operating two years after the fact, with data that’s two years old.
Additionally, if you dive into the numbers, the measures are not as sensitive as they could be to regional variation. For example, our health costs are determined based on a national tabulation by
PHAC, but, ideally, we would be able to work with Saskatchewan’s specific numbers. These could be tabulated by an organization like HQC that could regularly report on the associations between health system usage and income in Saskatchewan and assign dollar values to them.
The Laurie Method also covers most costs, but could probably cover more, so there are opportunities in the future to explore that.
There was a whole round of costs of poverty calculations that were done in Canada that culminated in the Saskatchewan work in 2014, and recently I’ve communicated with a number of partners at the national level and in various provinces about updating these numbers for the country and for all the provinces. Upstream has been leading this initiative with other partners at the national level, like the Campaign 2000 Coalition and Dignity for All. We’re expecting to be able to put something out within the next half a year, and I’m really excited about that.
More locally, there are lots of plans and interests around the costs of poverty in Saskatoon. The Saskatoon Poverty Reduction Partnership (SPRP) has been leading the way in unpacking and understanding poverty locally. Additionally, the Community University Institute for Social Research (CUISR) has been doing some very interesting work around social return on investment, which is a related concept to the cost of poverty.
In conclusion: What gets measured gets done
As the CUISR states in a recent report of theirs on the social return on local investments in Saskatoon: “what gets measured gets done.” With the costs of poverty work that we’re doing, it’s all about getting numbers and measures in order to mobilize and motivate action on poverty, which is a topic that’s near and dear to all of us working in the field.
QI Power Hour is a monthly webinar learning series hosted by the Health Quality Council. We bring together thought leaders from a variety of sectors with an interest in improving health to learn about quality improvement-related topics. The Q&A with Charles Plante is available at the 25:00 mark in the webinar recording, found here. For more information on upcoming QI Power Hours, click here.