
Jan 22, 2025
The Difference Between Data for Improvement, Data for Research, and Data for Accountability
Why is it important for Improvement Leaders to get their team on the same page when it comes to using data for quality improvement?
When multiple people are asked to consider the same idea, their unique personalities, training, and experiences can impact how they interpret, react, and respond. While diverse perspectives are good, they can also present as challenges on a team, when participants are using similar words to describe different concepts and scenarios.
We often encounter this experience on quality improvement teams, when we use the terms “data” and “measurement”. There can be misunderstandings around the different types of data and measurement, which can result in varying expectations about what measures to collect and how, as well as what to do with the measures on a team.
Miscommunication, disagreements and frustration surfaces when people aren’t on the same page with their understandings and expectations of data and measurement. So how can you better prepare your improvement team to navigate these conversations about measurement? Read this post to get a better understanding of three common, but distinct, forms of measurement, and when they are each used.
Table of Contents
- The importance of measurement
- Which process should you follow?
- Data for Improvement
- Data for Accountability
- Data for Research
- Publishing considerations
- There’s a time and a place for each method
- Reference tool
The importance of measurement
“What we measure shapes what we try to pursue – and what we pursue determines what we measure.” – Report by the Commission on the Measurement of Economic Performance and Social Progress.
But first, ask these questions:
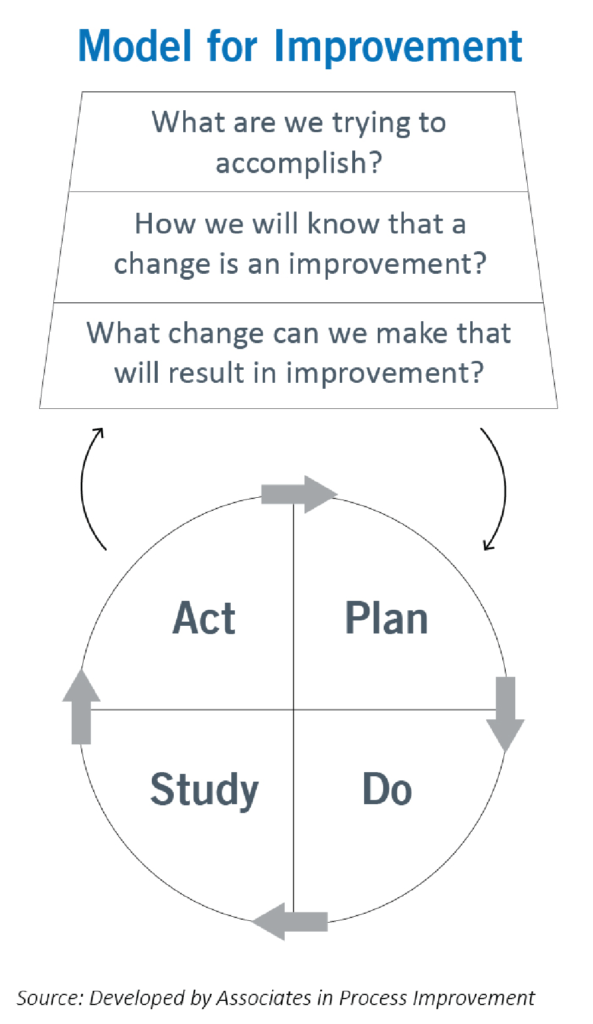
Measurement is a key component for the Model of Improvement and is based on these fundamental questions:
- What are we trying to accomplish?
- How will we know that a change is an improvement?
- What changes can we make that will result in improvement?
The three types of measurement
There are three types of measurement – Improvement, Accountability and Research – and each have their own unique characteristics.
As Solberg, Mosser, and McDonald said in their report on Performance Measures and Measurements, “We are increasingly realizing how critical measurement is to the quality improvement we seek, but also how counterproductive it can be to mix measurement for accountability or research with measurement for improvement.”
Think about it…
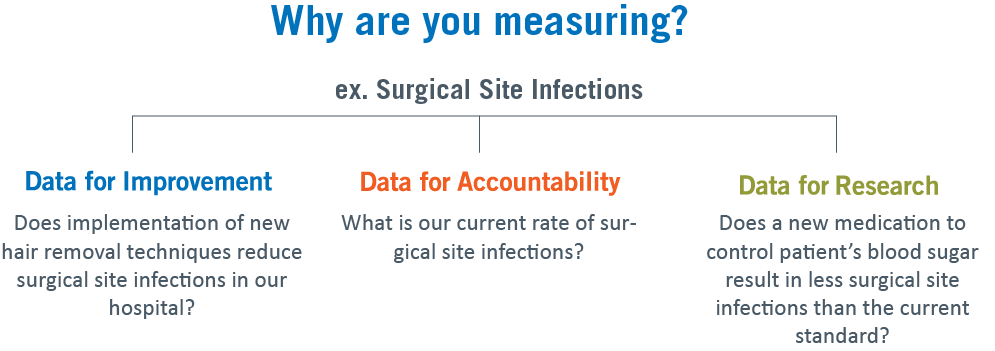
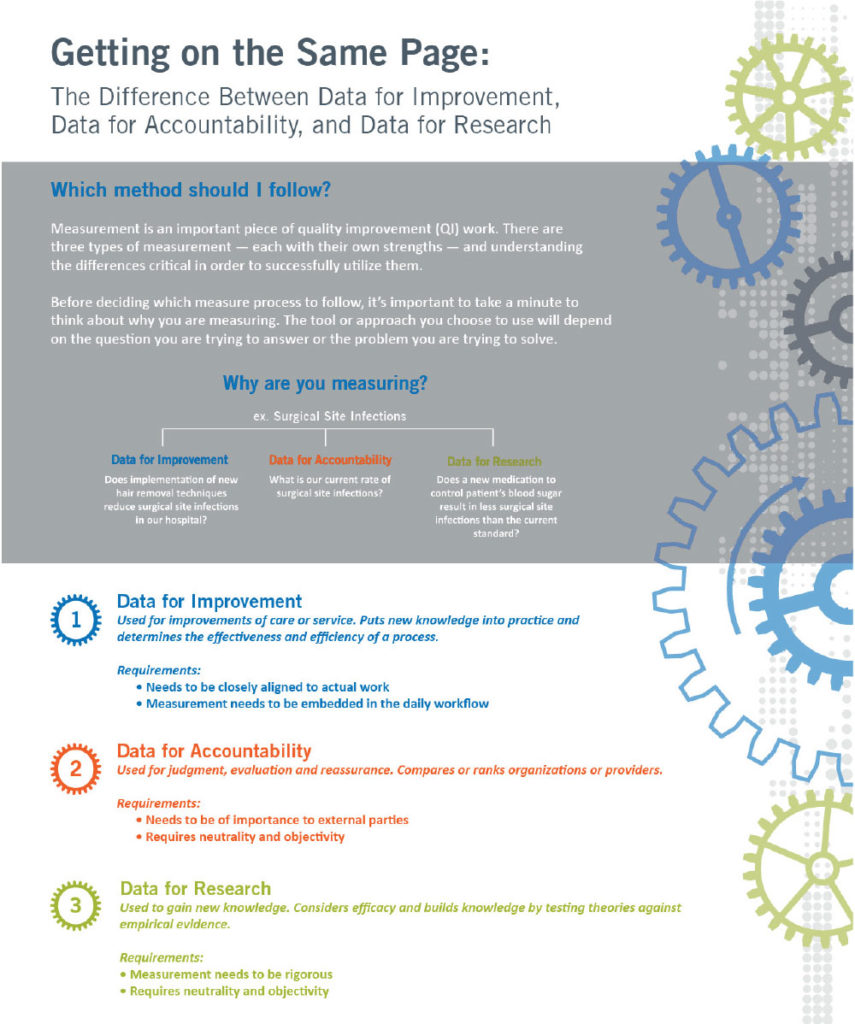
Before deciding which measurement process to follow, it’s important to take a minute to think about why you are measuring. The tool or the approach you choose to use will depend on the question you are trying to answer or the problem you are trying to solve.
Without fully considering or understanding how to use each of these types of measurements, you run the risk of not having the success you want to see or creating a future challenge for your team.
Which process should you follow?
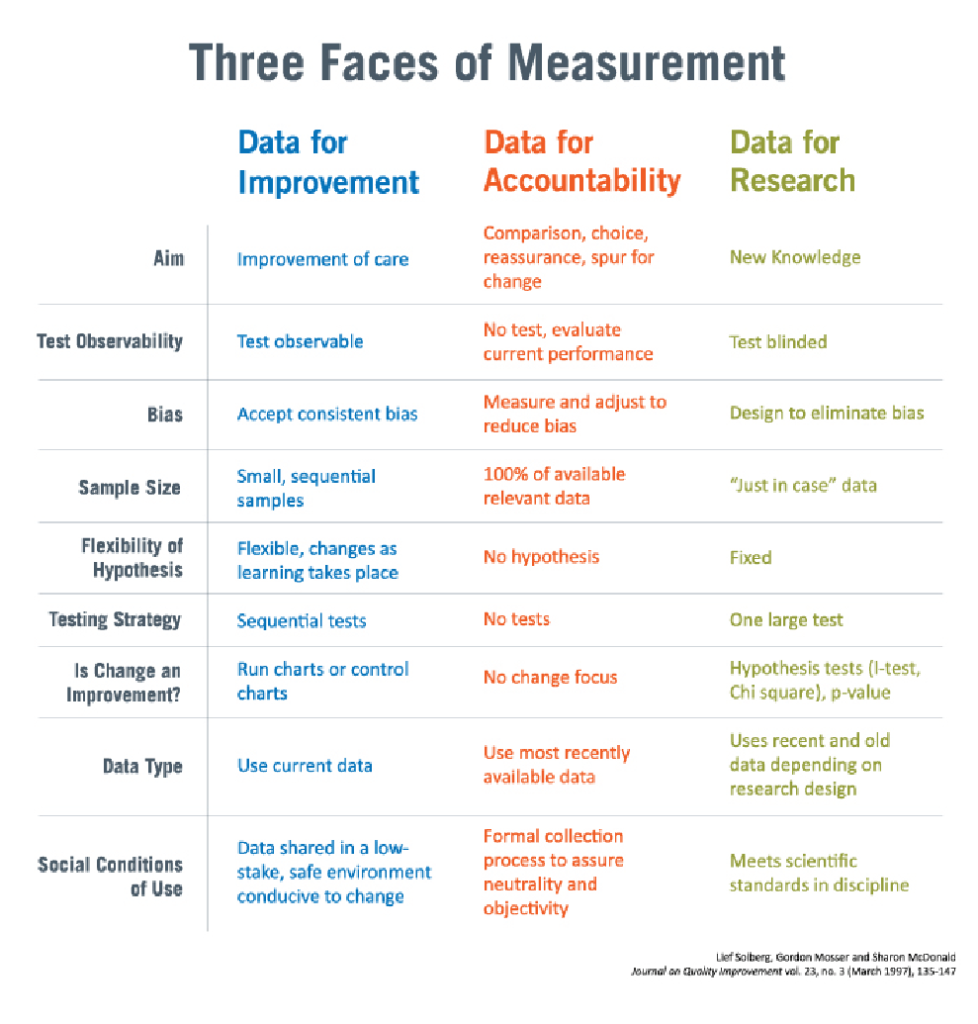
The Three Faces of Measurement Chart is often cited when people talk about performance measurement. A form of it originates from the healthcare data guide from Lloyd Provost and Sandra Murray. It outlines the specific characteristics of measurement and allows you to compare them based on the three types of measurement.
The chart will be used as a framework as we compare the characteristics of measurement for improvement, accountability, and research:
1. Data for Improvement
Purpose: Measures for Improvement takes a practical approach towards answering questions about the efficiency and the effectiveness of a process over time. Data for improvement is used to observe process performance, obtain ideas for other improvements, test changes to see if they’re effective, and see whether past improvements are being maintained.
Observability: This approach allows researchers to focus on small types of change and to try something, evaluate the results, and then try something else if it’s not working. We can constantly reconsider our approach and our hypothesis based on the previous test of change.
Bias: In this approach, we accept that bias exists, but we try to keep that bias stable over time in order to lessen its impact. When we design our data collection, we assume that bias will be present all the time. If our intervention results change, we know that it has happened in the face of bias that occurs in the real world.
For example, one bias that we often need to accept in QI projects is that all patients are different from one another and therefore the intervention that we’re testing could potentially work better for some compared with others simply because not all patients are exactly the same.
Sample Size: There is an art and a science to this. What you’ll need to do is think about your context and rely on your local experts to help you answer this question.
For example, if you’re trying to improve processes around stroke patients, you’ll need to remember that strokes on average occur only once or twice a week in Saskatoon, so you’re going to need more than one or two weeks worth of data to know if change is an improvement.
However, if you’re looking to improve a process around receiving an x-ray at the Regina General Hospital, that is something that happens many times a day and therefore perhaps the week’s worth of data would be sufficient.
In QI work, the ideal people to collect your data are those who are directly involved in the process and they are therefore often the ones who are providing direct care to the patients. Remember, there is a cost associated with time spent collecting data and you should think about what you want to know and how badly you need to know it.
Hypothesis: This approach often has many hypotheses that we want to test. As we do small tests of change, we’re flexible with the hypothesis we are trying, and we can change it depending on the results of our previous small test.
Testing Strategy: Improvement work is all about small, sequential tests of change. You can consider how an improvement team could be formed around one hypothesis, collect some data related to it, reflect on that, then decide how to move forward.
This allows the team to quickly see what is working and what isn’t. If something isn’t working, they can throw that idea out and try something else.
Data over time will often be displayed on run charts or control charts, and we use these tools to identify whether changes that occurred resulted in an improvement or not.
Data Type: We aim to use recent data or new data in our tests. Because we are collecting just enough data for our small tests of change, it’s not a big deal to stop collecting some data and start collecting new data if we change what we’re focusing on and want to test something different.
Confidentially: The data collected is meant to just be used by the team working on the project. Though the focus of improvement work is on processes and not people, people might be vulnerable to having their processes quantified and scrutinized.
If it is shared too largely outside of the core team
or your group it could be interpreted incorrectly and shine an uncomfortable light on the individual people or groups. This is the opposite of what we’re trying to accomplish with improvement work and it can make people hesitant to participate if they’re not sure of who’s going to be looking at their data or how it’s going to be interpreted.
2. Data for Accountability
Purpose: Measures for Accountability evaluate or judge the performance of a provider or organization. This approach can be used for evaluation, reassurance to highlight choice, and it’s often used to provide impetus for change. When we’re talking about data for accountability, we are usually talking about outcomes or results, not information on how results were achieved.
Observability: Accountability focuses on reporting on and evaluating current performance. Observability doesn’t come into play.
Bias: With the primary purpose of accountability work being to compare and evaluate, we try to be aware of bias and use statistical methods to account for it. A common practice for this is risk or severity adjustment where you use statistical methods to eliminate the impact of bias or differences that may exist between the populations you’re comparing.
Sample Size:
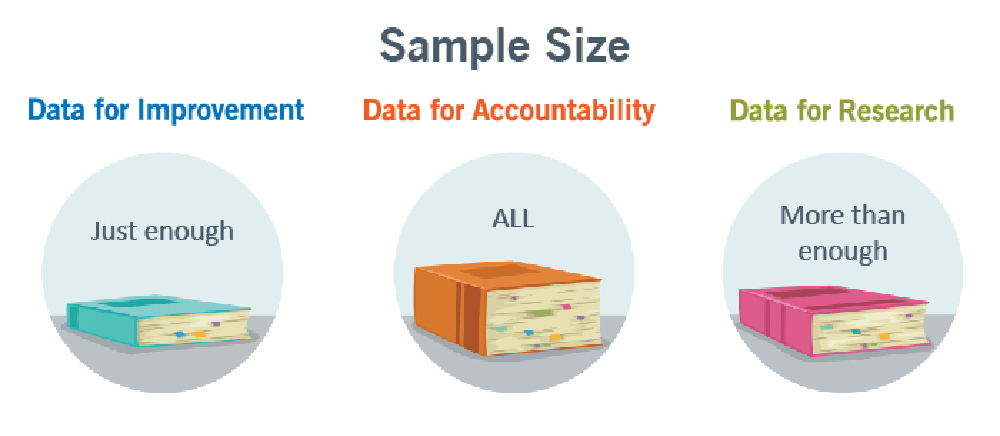
Sample size is extremely important because when generating information for accountability, the recommended practice is to use all relevant data because this method is intended to compare groups, focusing on being valid and reliable.
The samples need to be large enough to be precise, which means it often needs to be collected over a longer time period. The large sample size and the longer time period are why data collected for accountability is not often relevant for improvement work.
Hypothesis: We are not interested in changing or testing anything, so there is no hypothesis.
Testing Strategy: We’re only interested in the performance of a system at a fixed point in time, so there isn’t a testing strategy.
Data Type: The aim is to use the most recently available data. This combined with wanting to use all available data means there can be long lags before the data can actually be reported. As a result, the information you’ve made can be a bit out of date by the time we get it. This is one of the reasons it can be difficult to use data collected for accountability reasons for improvement work.
Confidentially: In accountability, the purpose of data is for general public consumption. We want to ensure neutrality and objectivity with our data. Confidentiality is not the focus.
3. Data for Research
Purpose: Measures for Research generates new knowledge. Research is typically concerned with efficacy or how a product or process works under ideal conditions.
Observability: You can’t observe the impact of change and learn from it throughout the process using this method because results aren’t analyzed until the data collection process is complete.
Bias: We try to minimize bias in research work. There are statistical methods to do this, but another common attribute of research is to have control groups that are matched to your testing group.
The goal is to control all possible variables other than those being studied. This is one of the reasons why the results from the research may underperform when they are applied to a real-world setting.
Sample Size: In Research, sample size tends to err on the side of collecting data just in case you’ll need it later. Since research studies are time intensive, they can be costly and difficult to change once you’ve started.
Hypothesis: An entire research project is designed around one fixed hypothesis. If you wanted to test another hypothesis, you would design and execute a different research project.
Testing Strategy:
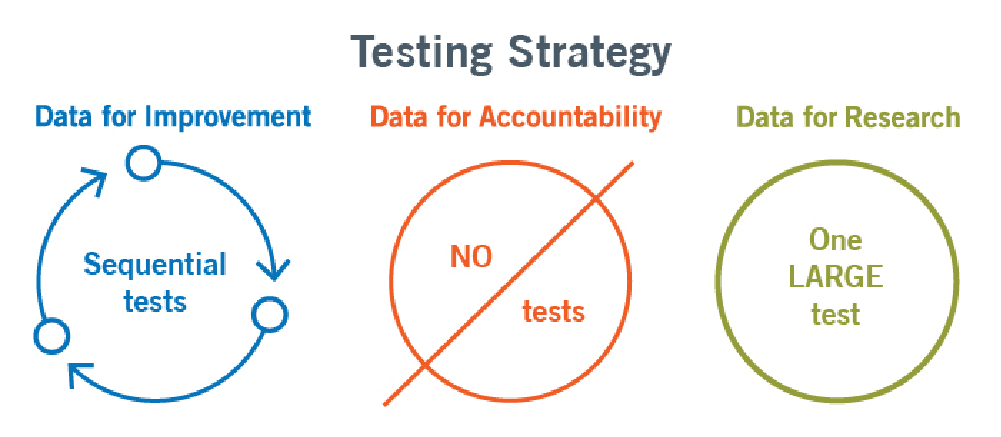
There’s typically one hypothesis that’s being tested and we often only get one shot at it to understand if A works better than B. We use statistical hypothesis testing in this approach to compare two or more groupings to understand if one is different than the other or not.
Data Type: We may use existing data or we may try to collect new data. It really depends on the research design and what the question is that you’re trying to answer in your research project.
Confidentially: Data generated from research is also intended for general consumption, but participant anonymity is often a crucial part of research studies. The need for confidentiality is high and there are standards for ensuring patient protection for individual subjects.
Confidentiality and role of patient or client involvement is a big factor in whether a project requires ethics approval or not. There are tools to assist people in understanding whether their project requires ethics review.
Publishing considerations
Publishing is also important in research. It’s not uncommon to hear pushback from people who don’t want to participate in improvement work because they believe they can’t publish their work, but improvement work can be published and there are guidelines that you can follow when preparing your improvement manuscript.
There’s a time and a place for each method
Despite the differences between the three methods, there isn’t a competition over which type of measurement is better than the other; They all have a valued place in improving a system. One way that I like to sum up how the different types can complement each other is that research can tell us the what, improvement can help us figure out the how, and accountability can speak to the where and the why.
Knowing what question you are trying to answer is critical to know what type of measurement you need, and ensuring that your team is on the same page and understanding the different attributes of each type of measurement is crucial to your success.
It’s important that people who support this work build skills in the three main types of measurement. Organizations need translators who are able to speak the language of each approach and understand that all are important, are valuable to understanding a system, and complement one another.
Each type of measurement has its own strengths and the one you use should depend on what you are trying to do with the data. You can get your team onto the same page by making sure all team members are familiarized with the types of measurements, when they should be used, and what you should expect from the results.
Getting on the Same Page Reference Tool