

May 25, 2026
Health care is, to say the least, a complex line of work, with many crisscrossed, interconnected systems, processes, stakeholders and functions. From a planning and policy perspective, these interdependencies give rise to wicked problems—that is, a problem, issue or dilemma that is seemingly impossible to solve.
Common examples of worldly wicked problems, beyond the scope of the health sector, include poverty, climate change and economic disparities. Some characteristics include:
- Difficult to clearly define
- Have many interdependencies and are often multi-causal
- Trying to solve them often leads to unforeseen consequences
- Are not stable problems
- Have no clear solution
- Are socially complex
- Hardly ever sit conveniently within the responsibility of any one organization
In health, there aren’t simple solutions to wicked problems, and the COVID-19 pandemic has only added to these complexities. Because the factors are incomplete, in flux, and difficult to define, solving wicked problems in health requires a deep understanding of the stakeholders involved and an innovative approach provided by design thinking—the process of understanding how components in a system influence each other.

One tool we can use to wrap our head around wicked problems—and work towards possible solutions—is the driver diagram.
Table of contents
- What is a driver diagram?
- Structure of a driver diagram
- Measuring success
- Tips to use driver diagrams effectively
- Conclusion
What is a driver diagram?
A driver diagram is a tool to organize your thoughts into action and to visualize how some of those problems can be solved. Similarly to process maps and fishbone diagrams, it’s a good tool for engagement because of its visual nature. It gives a reasonable view of a problem and how to implement changes. In many organizations, driver diagrams are used to inform strategic planning processes or engage with board members and other key stakeholders.
Driver diagrams are important because they are used to solve larger issues on a system-wide basis. Every system is perfectly designed to get the results that it gets, so if you want different results, you have to redesign the system. A driver diagram can help articulate our theory about how to do this.
Structure of a driver diagram
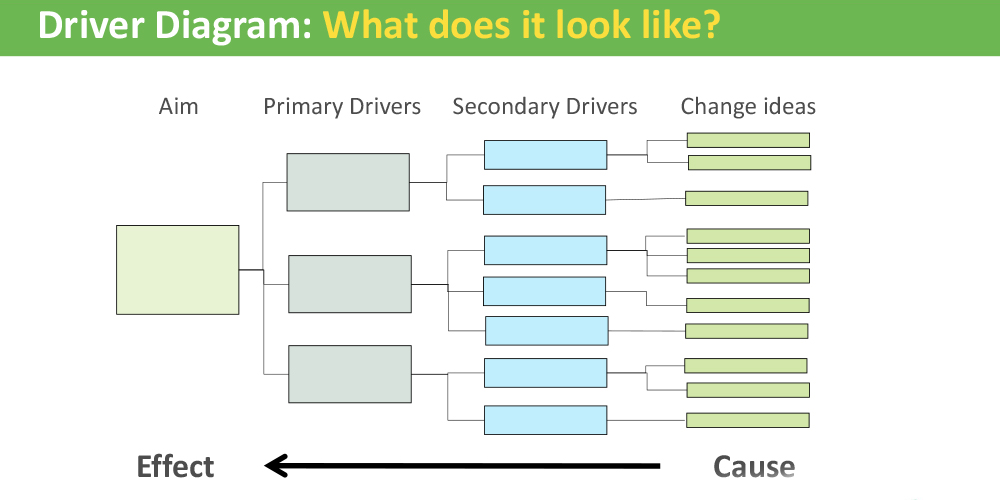
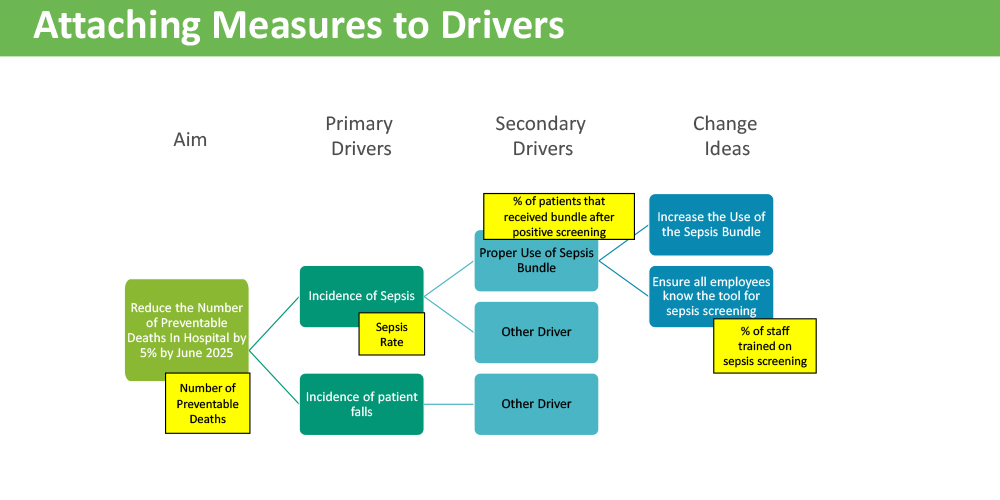
A driver diagram is a simple structure containing four (or more) columns), including the following elements:
1. Aim statement: Before you start building your diagram, you have to determine an aim for it: what is it you’re trying to achieve? Think about the impact you intend to have and the big problem you’d like to address—perhaps it’s part of a wicked problem mentioned above. It’s a good idea to build your aim using the SMART goals format. Not only does this method provide further details and direction (using the specific, measurable, aspirational (or achievable), realistic and timely acronym), but it also provides a tangible outcome and timeline for said goal. There is even a significant amount of research backing the benefits of SMART goals.

For example, having an aim statement of reducing long wait times in the emergency department (ED) can be ineffective—it is quite broad and doesn’t involve any of the above parameters. Revised as a SMART goal, however, it could be rewritten as: by June 30 2023, we’ll achieve a 10 per cent reduction in ED wait times at Saskatoon’s Royal University Hospital. This provides a higher level of detail, allowing for more focus on the goal.
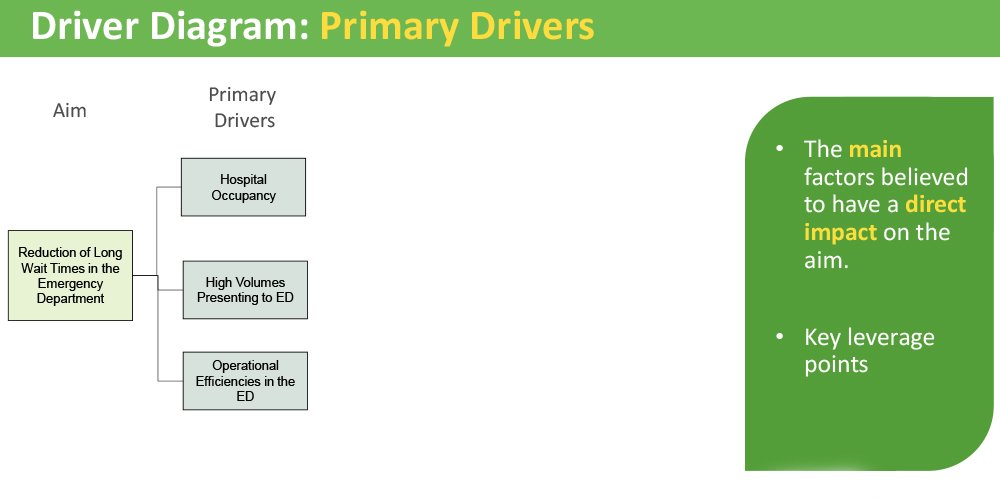
2. Primary drivers: These are the key factors and leverage points that may have a direct impact on the aim—that is to say, if we completed these, we could achieve the aim. Speaking about ED wait times (see photo below), some drivers to consider include hospital occupancy, the volume of people presenting to the ED and the operational efficiencies in the ED.
3. Secondary drivers: These are smaller in scope than the primary drivers that may impact the primary drivers. Secondary drivers are usually processes and work that can be improved at a local level. With ED wait times, some examples of secondary drivers include a shorter hospital patient stay (leads to fewer patients and more staffing resources to attend to the ED), human/health resourcing (additional staff to work in the ED) and access to preventative services in the community, such as diagnostics and primary care (both of which could alleviate ED traffic).
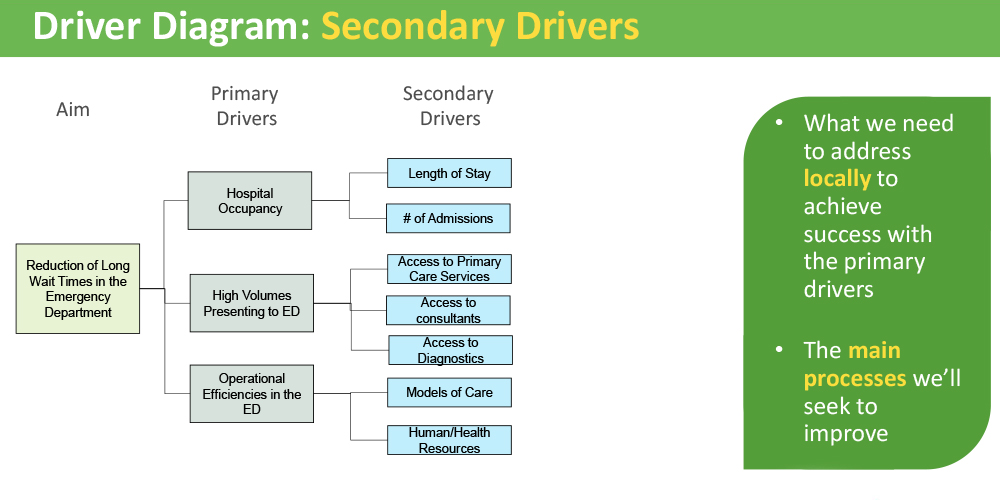
Note that you may have more than two levels of drivers, especially if you need to dive in deeper to your aim.
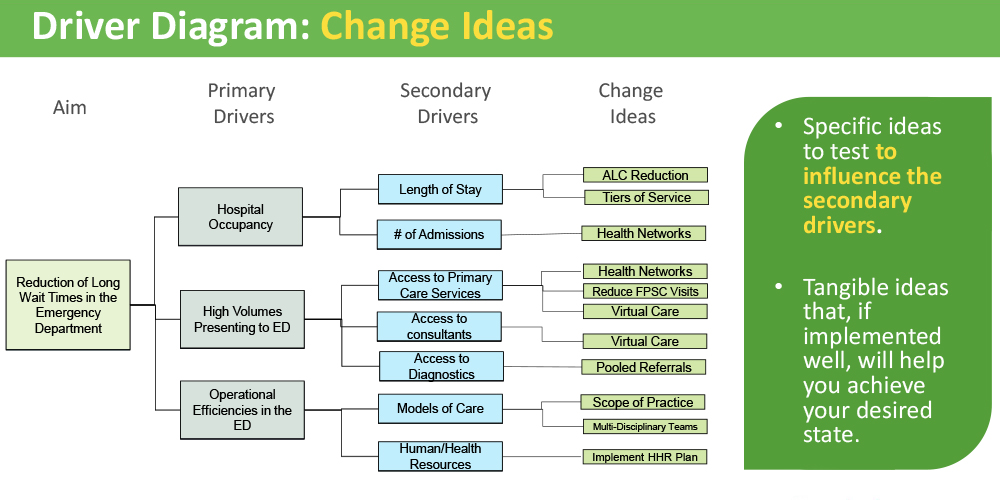
4. Change ideas: Think of these as the specific, tangible pieces of work that are typically easier to implement or complete. These affect the secondary drivers, followed by the primary drivers, which feeds into the aim statement. One example of a change idea that gained a lot of traction during the COVID-19 pandemic was virtual care. If a patient is able to “visit” their family physician via video, they can receive the care they need before their health reaches a critical stage where an ED visit is needed. This leads to a lower number of people presenting in the ED—ultimately serving the aim.
Measuring success
With driver diagrams, it’s relatively simple to figure out what you’re measuring and how to measure it. Measures can be attached to the aim statement, the primary and secondary drivers, and in some cases even the change ideas. As mentioned, having a clear aim statement—based on a SMART goal—will make it that much easier to measure the results.
However, it is important to be strategic about your measuring. Measuring everything comes at a cost of time or other resources, be it human or fiscal. This rings true if you’re working with a partner organization who may not have the resources to measure every single aspect. Instead, focus on the data that dovetails into system change—your aim statement. Another measurement strategy is to pick one or two balancing measures. That way, you can highlight the work going on within these couple areas or processes, while monitoring other areas for any potential impacts.
Tips to use driver diagrams effectively
- The aim helps the system: With a clear aim, you will have a better sense of the scope of your work and what is entailed to move onto the next step. Be clear on the aim before you begin.
- Prepare to get messy: Secondary drivers can contribute to multiple primary drivers. Think of it as a game of Scrabble, when you play your squares that connect to (or impact) other words.
- It doesn’t have to be perfect: The goal is the thinking that goes into building the diagram, not the diagram itself. Driver diagrams are meant to be a conversation starter and a big-picture view on system change.
- Use it as a guide: Driver diagrams are not set in stone. Rather, they are living documents, like a team charter or A3. Review it regularly and update as needed.
- Look for the quick wins: These can be secondary drivers or change ideas that can be completed quickly and with minimal resources or intervention. It’s energizing to strike out something on your to-do list, even if it’s for a smaller task. Plus, it all feeds into the aim.
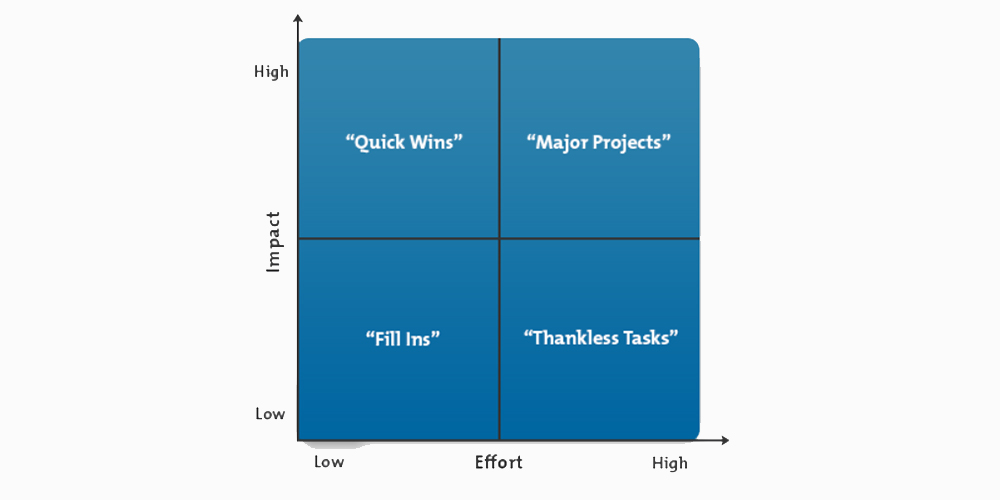
- Prioritize, prioritize, prioritize: Once you’ve created your diagram, use a prioritization matrix to identify which concepts to tackle, and when. If it’s a high priority, schedule accordingly; if it’s not urgent, perhaps it can wait.
Conclusion
Like a big ball of tangled yarn with no end, wicked problems are complex dilemmas with no easy solution. Common depictions of wicked problems in health care include chronic ED crowding, lack of primary care options or lengthy surgery waitlists. One way to begin to understand and work towards possible solutions is to map it into a driver diagram. With roots in design thinking, a driver diagram depicts how small activities feed into secondary and primary drivers, ultimately working towards a shared goal or aim. By creating a visual of this change program, you can understand complex issues, identify areas of change and work to address them.